How to Build an SEO Reporting Dashboard for Clients That Actually Gets Read
 Grzegorz Graczyk13 min read
In agency work, a common failure mode is that SEO reporting dashboards are built for the person doing the work, not the person paying for it. They contain every ranking fluctuation, every crawl warning, every backlink count, and every analytics widget the agency can connect. Then everyone wonders why the client only reads the first slide, skims the charts, and asks, “So… is this good?”
A useful SEO reporting dashboard for clients is not a warehouse for SEO data. It is a decision tool. It should help a client understand three things quickly: whether SEO is moving the business in the right direction, what caused the change, and what the agency is doing next.
That requires discipline. The best client dashboards leave things out on purpose, translate SEO metrics into business language, and make the next action impossible to miss.
Why most client SEO dashboards don’t get read
Client reporting fails when it asks non-SEO stakeholders to do the agency’s interpretation work. A dashboard full of charts may look thorough, but thorough is not the same as useful.
Most unread dashboards suffer from one or more of these problems:
Too many metrics: The client cannot tell which numbers matter most.
No business context: Rankings and clicks are shown without leads, revenue, key events, or pipeline impact.
SEO jargon: Metrics like average position, crawlability, canonicalization, and domain authority appear without explanation.
No narrative: The dashboard shows what changed, but not why it changed or what will happen next.
No prioritization: A minor technical warning sits beside a major conversion issue as if they are equally important.
Clients do not need less transparency. They need better hierarchy. Your dashboard should answer the client’s real question before it shows them the underlying data: Are we making progress toward the outcome we hired you to improve?
Start with the client’s business question, not the SEO tool
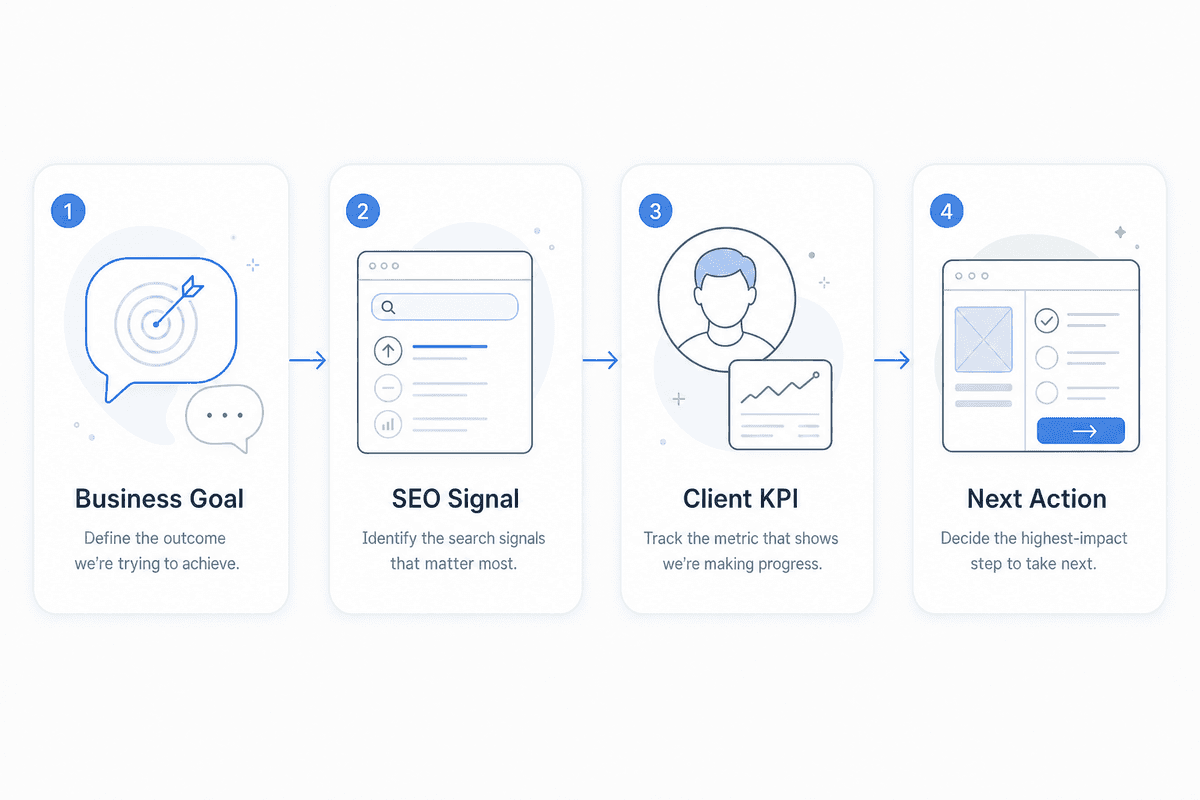
The most important dashboard decision happens before you choose a chart type or reporting platform. You need to define what the client actually wants SEO to accomplish.
A local service business may care most about qualified calls and form submissions. An ecommerce store may care about organic revenue and category-page growth. A SaaS company may care about demo requests, trial signups, and high-intent non-branded visibility. A publisher may care about traffic growth, engaged sessions, and content velocity.
Do not start with “What can we report?” Start with “What decision should this report help the client make?”
Map goals to reporting layers
A simple mapping process keeps the dashboard focused:
Business goal: What outcome matters to the client?
SEO signal: Which search behavior indicates progress?
Client KPI: Which metric makes that progress understandable?
Next action: What will the agency do based on the result?
For example, if the goal is more qualified leads, the dashboard should not lead with “27 keywords improved.” It should lead with organic leads, lead quality indicators where available, top converting landing pages, and the specific keyword or content improvements that influenced those results.
Google Analytics defines key events as user actions that are especially important to the success of the business, which makes them useful for reporting on outcomes such as form submissions, purchases, or other meaningful actions. If you use Website Analytics in ProjectHQ, the same principle applies: focus the client view on traffic sources, top pages, and conversions that explain whether organic search is producing meaningful outcomes.
An anonymized example: from data dump to decision tool
For one lead-generation client, the original report led with a long keyword table, overall organic sessions, and a technical audit score. The client’s real goal was simpler: understand whether SEO was producing qualified service inquiries and where the next budget should go.
The revised dashboard moved the client view to five core elements: organic form submissions, calls from priority landing pages, non-branded visibility for service terms, top converting pages, and a short “done / doing / next” action summary. Keyword detail and crawl exports stayed available for the SEO team, but they were no longer the first thing the client saw.
That structure changed the reporting conversation. Instead of debating individual ranking fluctuations, the review focused on which service pages were creating inquiries, which pages needed conversion improvements, and which technical or content tasks deserved priority before the next reporting cycle.
Use a three-layer dashboard structure
A dashboard that gets read is structured like a good executive update. It starts with the answer, then gives evidence, then clarifies the action plan.
Layer one: the executive snapshot
This is the top of the dashboard. It should be understandable in less than a minute.
Include a short summary and a small scorecard of the most important KPIs. For most clients, this might include organic conversions, organic traffic, priority keyword visibility, and progress against the main goal.
The snapshot should also include a plain-English status: on track, improving but behind target, flat, or needs attention. Avoid making the client infer status from a line chart.
Layer two: the performance drivers
This layer explains why the headline changed. It may show top organic landing pages, ranking movement for priority topics, click-through rate changes, content performance, or branded versus non-branded demand.
This is where SEO context belongs. If organic traffic increased because one blog post spiked for a low-intent query, say that. If leads increased even though traffic was flat because service pages converted better, say that too.
Layer three: the action backlog
The final layer turns reporting into trust. Show what was completed, what is in progress, and what is planned next.
This does not need to be a project management board. A simple “done / doing / next” section is often enough. The point is to connect performance to agency judgment, not leave the client staring at historical data.
The metrics clients actually care about
There is no universal SEO dashboard that fits every client. But there are metric categories that tend to matter because they connect search performance to business outcomes.
Outcome metrics
Outcome metrics belong at the top because they are closest to the reason the client pays for SEO. Depending on the business, these may include:
Organic leads or form submissions
Phone calls from organic landing pages
Demo requests, trial signups, or booked consultations
Organic revenue or purchases
Qualified contacts or pipeline influenced by organic search
If the client has a longer sales cycle, you may not be able to attribute closed revenue neatly to SEO every month. In that case, report the best available leading indicators, such as qualified inquiries, high-intent page visits, or contacts created from organic sessions. ProjectHQ’s CRM & Contacts can help connect visitor activity and contact records when that level of journey context is needed.
Visibility and demand metrics
Google Search Console’s Performance report includes clicks, impressions, CTR, and average position. These are useful because they show how a site performs in Google Search results before visitors reach the website.
For clients, prioritize the visibility metrics that explain business-relevant movement:
Organic clicks and impressions for priority pages
Non-branded query growth
Average position trends for target keyword groups
Ranking movement for high-intent terms
CTR changes on pages that already earn impressions
Rankings still matter, but they should not dominate the report. A dashboard that shows 200 keyword movements without explaining which ones affect demand or conversions creates noise. A tool like ProjectHQ’s SEO & Rank Tracking is most useful in client reporting when rankings are grouped around topics, pages, intent, or opportunities rather than dumped into a giant table.
Page and content metrics
Top landing pages help clients understand what is actually attracting organic visitors. But page metrics should answer a strategic question, not fill space.
Useful page-level views include:
Top pages by organic conversions
Top pages by organic traffic growth or decline
High-impression pages with low CTR
Pages that rank but do not convert
New content performance after publication
This is where SEO reporting starts to improve execution. A page with strong impressions but weak CTR may need title and meta description work. A page with traffic but no leads may need a stronger offer, clearer call to action, or better internal path.
Technical health metrics
Technical SEO belongs in client reporting, but usually as a risk summary rather than an audit dump. Clients need to know whether technical issues are blocking performance, whether fixes require development resources, and what the impact is likely to be.
Instead of showing every crawl warning, summarize technical health like this:
Critical issues affecting indexation, crawling, speed, or user experience
Issues fixed this period
Issues awaiting client or developer approval
Expected impact of the next technical fix
The client does not need every diagnostic detail unless they are the person responsible for fixing it.
What to leave out of the client view
A readable dashboard is created as much by subtraction as by addition. Keep detailed data available internally, but do not force it into the client-facing view unless it supports a decision.
In most client dashboards, you can safely remove or minimize:
Every tracked keyword: Show priority groups, winners, losers, and opportunities instead.
Raw crawl exports: Summarize risks and actions. Keep the export for the SEO team.
Unexplained tool scores: A score is only useful if the client knows what changed and why it matters.
Vanity backlink counts: Report link quality, relevance, or campaign progress when link building is part of the scope.
Unqualified traffic totals: More traffic is not automatically better if it does not support the client’s goals.
Charts with no takeaway: If a chart does not change the client’s understanding, remove it or move it deeper.
A good rule: if you would need five minutes to explain why a metric matters, it probably does not belong in the executive layer.
How to design the dashboard so it gets read
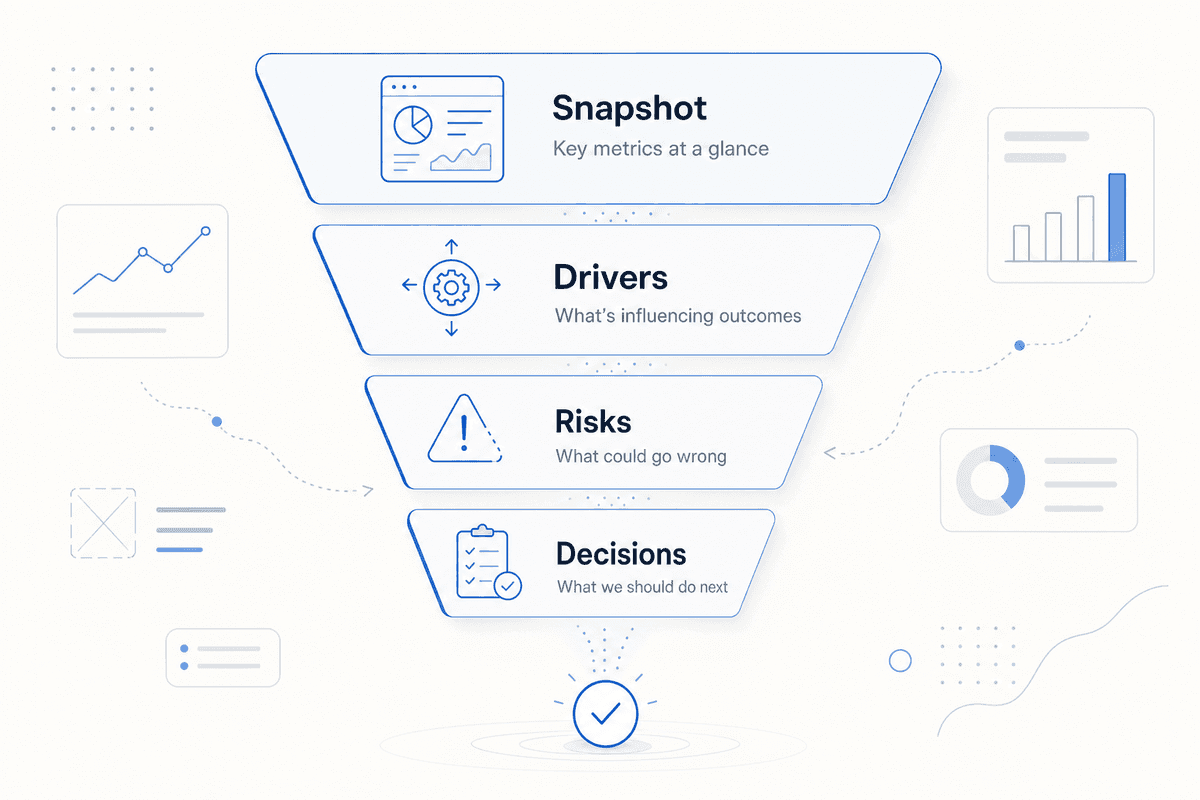
Even the right metrics can be ignored if they are arranged poorly. Design the dashboard for how clients actually consume reports: quickly, between other priorities, often right before a meeting.
Put the answer first
Start with a written summary. Two to four bullets are enough:
What changed this period
Why it changed
What it means for the business
What you recommend next
This summary is not fluff. It is the most important part of the report because it shows the agency’s interpretation.
Use comparisons carefully
Treat month-over-month comparisons as directional rather than definitive, especially for seasonal businesses or volatile content sites. When relevant, add same-period-last-year comparisons, rolling averages, or progress against a goal so the client has enough context to interpret the change.
Do not make clients guess whether a 12% drop is a problem. Explain whether it reflects seasonality, tracking changes, ranking loss, lower branded demand, or a known external factor.
Add annotations
SEO results often lag behind the work. A client may not remember that a content refresh went live three weeks ago or that a developer fixed indexation issues mid-month. Add notes to major changes so the dashboard tells the story.
Useful annotations include:
New pages published
Content updates completed
Technical fixes deployed
Algorithm volatility or SERP changes
Tracking or website changes that affect the data
Use client-friendly labels
You can keep technical definitions in the background. In the client view, use labels that make the metric’s role obvious.
For example, “Search visibility for priority services” is usually clearer than “Average position.” “Organic leads” is clearer than “Key events from default channel group: Organic Search.” The underlying data can still be precise; the label should be human.
Build the agency workflow behind the dashboard
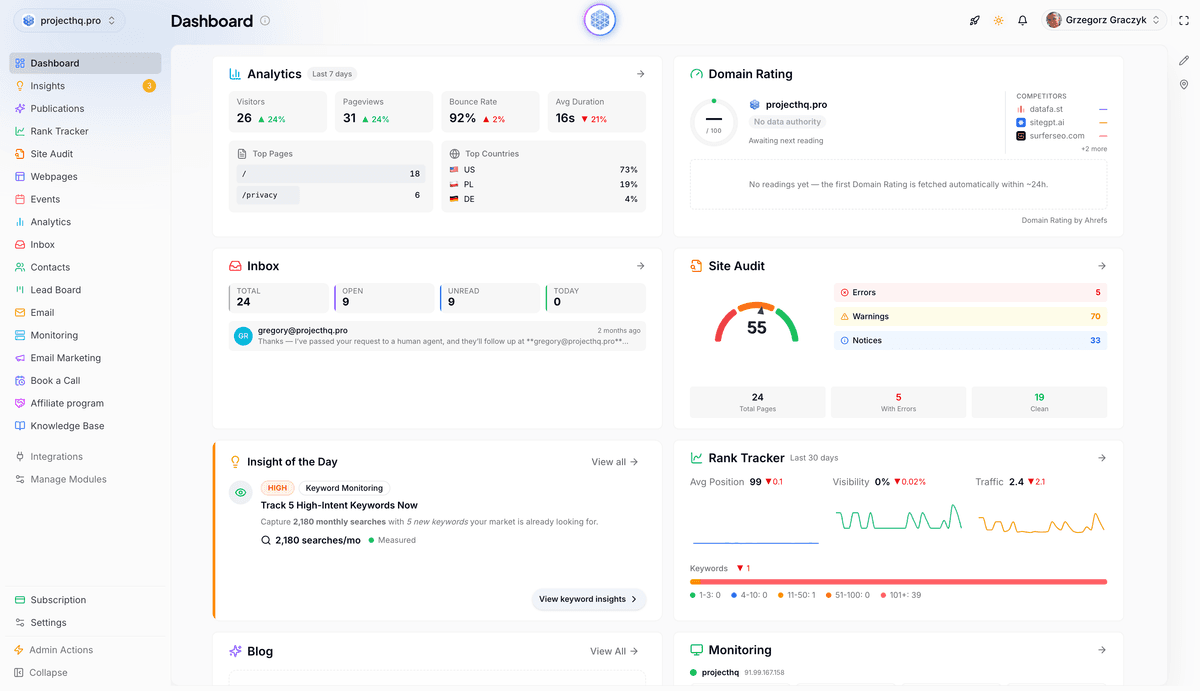
A client dashboard is only as good as the workflow behind it. If no one owns the report, reviews the data, or adds interpretation, it becomes another automated email clients ignore. The ProjectHQ multi-project view shown here is an example of the report-prep triage layer: an agency can scan client sites, spot which accounts need attention, and decide where deeper analysis is required before building the client-facing narrative.
Separate monitoring from reporting
Agencies need live monitoring. Clients need a coherent performance story. Those are related, but they are not the same thing.
Your internal SEO team may monitor keyword volatility, crawl issues, page speed changes, and traffic drops throughout the week. The client-facing report should summarize what matters from that monitoring, not expose every internal alert.
Assign a reporting owner
Before each report goes out, one person should review the dashboard and answer:
What is the most important thing the client needs to know?
Which metric needs explanation?
What decision or approval do we need from the client?
What will we do before the next report?
This review step is what turns charts into client communication.
Use one system where possible
Agency reporting tends to become harder when every client requires a different stack of tools, logins, exports, and spreadsheets, so standardizing the reporting workflow is often worth the effort. ProjectHQ is built for this kind of multi-client workflow: agencies can manage client sites from one dashboard, view client analytics, monitor rankings, and connect SEO performance with broader website activity. The ProjectHQ agency page explains the multi-project setup and the flat per-site model for agencies that want to avoid rebuilding a separate tool stack for every account. If your agency already has a mature stack, the same dashboard principles can also be implemented in Looker Studio, spreadsheet dashboards, or other reporting platforms.
That does not mean every client report should be product-generated end to end. The strategic layer still comes from the agency. But when analytics, rank tracking, and client sites are easier to manage in one place, the team has more time to add the commentary clients actually value.
A practical client SEO dashboard template
Use this structure as a starting point, then customize it by client type, scope, and maturity.
Dashboard section | Example metrics | Client question answered | Update cadence |
|---|---|---|---|
Headline summary | Status, key win, key concern, next action | What should I know first? | Monthly or weekly |
Goal scorecard | Organic leads, revenue, key events, goal progress | Is SEO helping the business? | Monthly |
Organic acquisition | Organic clicks, sessions, impressions, source trends | Are we attracting more search demand? | Weekly or monthly |
Ranking and visibility | Priority keyword groups, average position trends, SERP features | Are we becoming more visible for the right searches? | Weekly or monthly |
Top pages | Top converting pages, traffic gains/losses, CTR opportunities | Which pages are driving or limiting performance? | Monthly |
Risks and blockers | Indexing issues, technical priorities, approvals needed | What could slow progress? | As needed |
Completed work | Pages updated, fixes deployed, content published | What did the agency do? | Monthly |
Next actions | Planned tests, content briefs, technical fixes, conversion improvements | What happens next? | Monthly |
For ecommerce clients, weight the scorecard toward revenue, product or category performance, and high-intent landing pages. For lead generation clients, emphasize qualified inquiries, conversion rate by page, and service-area visibility. For content-led businesses, include new content performance, refresh opportunities, and topic-level visibility. To operationalize the template, add three internal fields to each section: the data source, the reporting owner, and the “when to flag” rule. For example, the owner might flag a priority landing page when conversions fall, tracking changes occur, rankings drop for the page’s main query group, or the result requires a client approval before the next action can happen.
Tie reporting back to SEO execution
The real value of reporting is not the report. It is the decisions the report improves.
A strong SEO dashboard should feed directly into your execution plan. For example:
A high-impression page with weak CTR becomes a title and meta description test.
A ranking page with poor conversions becomes a landing-page improvement task.
A topic cluster with rising impressions becomes a content expansion opportunity.
A technical issue affecting important pages becomes a development priority.
A keyword group stuck below page one becomes a brief for supporting content or internal links.
If Search Console shows strong impressions but underwhelming clicks, use the process in How to Improve Organic CTR Without Ranking Higher to identify pages where snippet improvements can earn more traffic from existing visibility.
If reporting reveals a content gap, turn that insight into a focused brief rather than a vague writing assignment. The guide on how to create an SEO content brief explains how to connect search intent, SERP expectations, internal links, and conversion goals before drafting begins.
This is the loop clients want to see: measure performance, interpret the signal, choose the next action, and show progress the following month.
Make the dashboard a trust-building asset
An SEO reporting dashboard for clients gets read when it reduces uncertainty. That means fewer vanity metrics, clearer business outcomes, plain-English interpretation, and a visible action plan.
Clients do not need to see every detail your SEO team sees. They need to understand whether the work is creating momentum, where the constraints are, and why your next recommendation is the right one.
Build the dashboard around that job. Lead with outcomes. Explain the drivers. Surface risks only when they matter. End with next actions. If your agency also needs a simpler way to manage client sites, rankings, analytics, and reporting inputs in one place, ProjectHQ’s agency workflow is a natural fit. But the principle is bigger than any tool: the dashboard that gets read is the one that helps the client make sense of SEO.
Grzegorz is the founder of ProjectHQ and has spent 15+ years in SEO — from technical audits to content strategy that ranks. He builds the product he writes about, so the playbooks here come from running real campaigns, not theory.
Ready to grow traffic?
Write SEO-optimized articles and track your rankings with ProjectHQ.
Get started